Enter a stock symbol
Enter a stock symbol to view that company's Altman Z-Score if it is a manufacturing company, or its Altman Z"-Score, if it is a non-financial, non-manufacturing company, and to view message board posts for that stock (Scores are available for premium members).
Screener
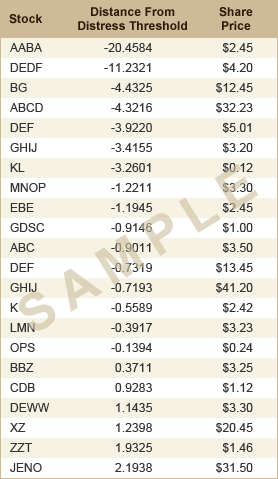
Below is a list of today's twenty-five most distressed stocks (according to their Altman Z-Score or Z''-Score, respectively) with a share price of $5 or higher. For details on how this ranking list is compiled, please click here.


Stock Chart
Flash Player 9 or higher is required to view the chart
Click here to download Flash Player now
SPY - Dangerous Time For Shorts
During the June/July lows I pulled up a 35 year chart of the S&P, and was immediately concerned with what I saw. Put simply, we dropped too far, too fast. It looked a lot like the 1998 correction. There was not enough bullish resistance(denial) to form a nice right shoulder yet. My suspicions were validated when we did not hit new lows on the last dip, which is what should have happened for the downtrend to continue. Instead, the chart formed a head and shoulders reversal pattern, leading to the rally that has just topped for now.
Looking at the chart today, there seems to be a good chance slide to (at least) the 50 Day MA over the next few days (although tomorrow itself might be green, which would make it a good day to open a particularly juicy short). Use the coming dip to lighten up weaker short positions. If this dip does not take us below 1060, then there is more pain ahead for the bulls. If we break 1060, then we will probably hit new lows once more so at that point quickly reload.
Zooming back out to the bigger picture, it is still not clear if we are going to still form a broad enough right shoulder to cause a big drop soon, or if this is just a 1998 correction. Keep in mind that governments will probably do everything in their power to keep this leaky boat afloat, including buying stocks themselves, painting the tape, lying about economic data etc to lure investors back in.
I will say this: The longer we stall around the 200day MA, the more likely we are to have a big drop. If solid footing is found significantly above the 200 day MA over the next month, then new highs are likely in the works. I have my doubts about that happening, but from a strictly TA point of view, it's possible. My doubts are rooted in the nature of these little rallies, with much of the volume and price movement taking place in the last 30 minutes on key days. Suspicious. Also, I think at this point investors are too skeptical to really buy into "The bull case" no matter what CNBC says.
A combination of newly reported earnings and rallying stocks should be producing new stocks popping up in our Shortscreen filters, so everyone make sure to keep your eyes peeled and post what you find. I would only open shorts on the weakest stocks for now, and tomorrow should be a good day to do so if it's green.
Submit a comment
In order to comment please sign in.
You're right about retail investors being skeptical. Check out the ICI equity mutual fund flow stats, net outflows each of the last four weeks: http://www.ici.org/res... It must be mostly the big prop desks propping up the market. How long will they keep that up if the bag holders don't come back to the table?
Something else a little troubling about the ICI numbers: there are still net inflows into muni bond funds. That means that many retail investors are still oblivious to the parlous state of state finances in places like CA, NJ, etc. (even though Governor Schwarzenegger just declared a fiscal state of emergency in CA). A big muni default at this point might incite more panic than another stock crash, since it will be more unexpected to many "conservative" investors.
Yes, there are a number of shadowy silhouettes fluttering about on the horizon that are capable of coalescing into black swans. The muni bond market is one, so is the Chinese economy.