Enter a stock symbol
Enter a stock symbol to view that company's Altman Z-Score if it is a manufacturing company, or its Altman Z"-Score, if it is a non-financial, non-manufacturing company, and to view message board posts for that stock (Scores are available for premium members).
Screener
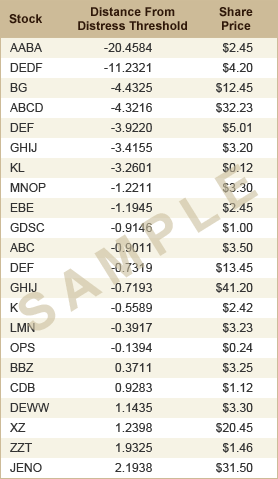
Below is a list of today's twenty-five most distressed stocks (according to their Altman Z-Score or Z''-Score, respectively) with a share price of $5 or higher. For details on how this ranking list is compiled, please click here.


Stock Chart
Flash Player 9 or higher is required to view the chart
Click here to download Flash Player now
OII - Long half of pairs trade
Going short TRMA. Details: http://bit.ly/7XnKJB
Submit a comment
In order to comment please sign in.
Your TRMA/OLL trade has worked well so far (about 4% return since yesterday's open) - because TRMA has been falling faster than OLL. It'll be interesting to track it over a longer period. Following up my comment on The Hackensack, is there any way to get historic Z-scores? Besides testing this pairs approach, I'd like to get a better sense of how to time a trade in a distressed stock. When taking a long position, I always look for some sort of event or catalyst that signals an imminent price increase. But I'm not clear on what sort of events signal price drops.
In this case, the downgrade today of OII by CapitalOne southcoast ( http://finance.yahoo.c... ) seems to have been a catalyst for its price drop today, not that I could have known about that yesterday.
I've seen historic market-average data on Altman Z-scores (I think in one of the Altman papers linked to in the footnotes on this site), but I don't know of a way to pull up historic Z-scores on a particular stock. You could look up the old financial statement and market value of equity data and use Ironwood's calculator ( http://www.ironwoodadv... ) to crunch the numbers on a specific stock.
Regarding how to time shorting distressed stocks, I don't know how to do that exactly, but I feel more comfortable shorting or buying puts on stocks that have run up a few hundred percent from the March lows and seem to be petering out now. You could try a more refined version of technical analysis than that, I suppose.
Just my opinion, but I think it might be a better time to add net short exposure now than enter into more pairs trades. I say that based on my view that the broader market is overvalued here and ripe for a correction. I don't know when that correction will come, but if I had to guess, I'd say sometime this year. I've only been going out about six months on the puts I've been buying, because it often looks cheaper to me to do that twice, if necessary, with $.5x than buy longer-dated puts with $1x. Again, just my opinion, though that observation is consistent with empirical research my finance consultant has done in another context (the development of the next site).
From Seeking Alpha, more info on OII from Arnold Landy, for whom OII is his highest conviction pick.
Forgot the link: http://bit.ly/6E8QqS
Got stopped out of OII today for a loss of about 9.5%.
Bought to cover the TRMA side of this trade at $4.45 today, for a gain of about 16% on that side. Net gain on the pairs trade with OII of about 6.5%